The Family Office Average Isn't Your Family.
By Nick Bryant, Co-Founder and CTO, SMB Investor Network
6 min read
At a glance
Read family office allocation surveys with care. Check the sample, wealth measures and spending needs before applying their lessons to your own portfolio.
The families that took part in the UBS survey had an average net worth of $2.7 billion1. The survey does not establish whether its respondents’ spending, cash access or staffing match yours1. Read who was asked, and what was measured, before any survey finding changes what you own.
Who responded to family office allocation surveys?
UBS surveyed 317 family offices for its Global Family Office Report and reports an average family net worth of $2.7 billion among the families that took part1. UBS is a bank reporting on its own survey, and its campaign page describes the participants as family-office clients. That is the group the findings describe.
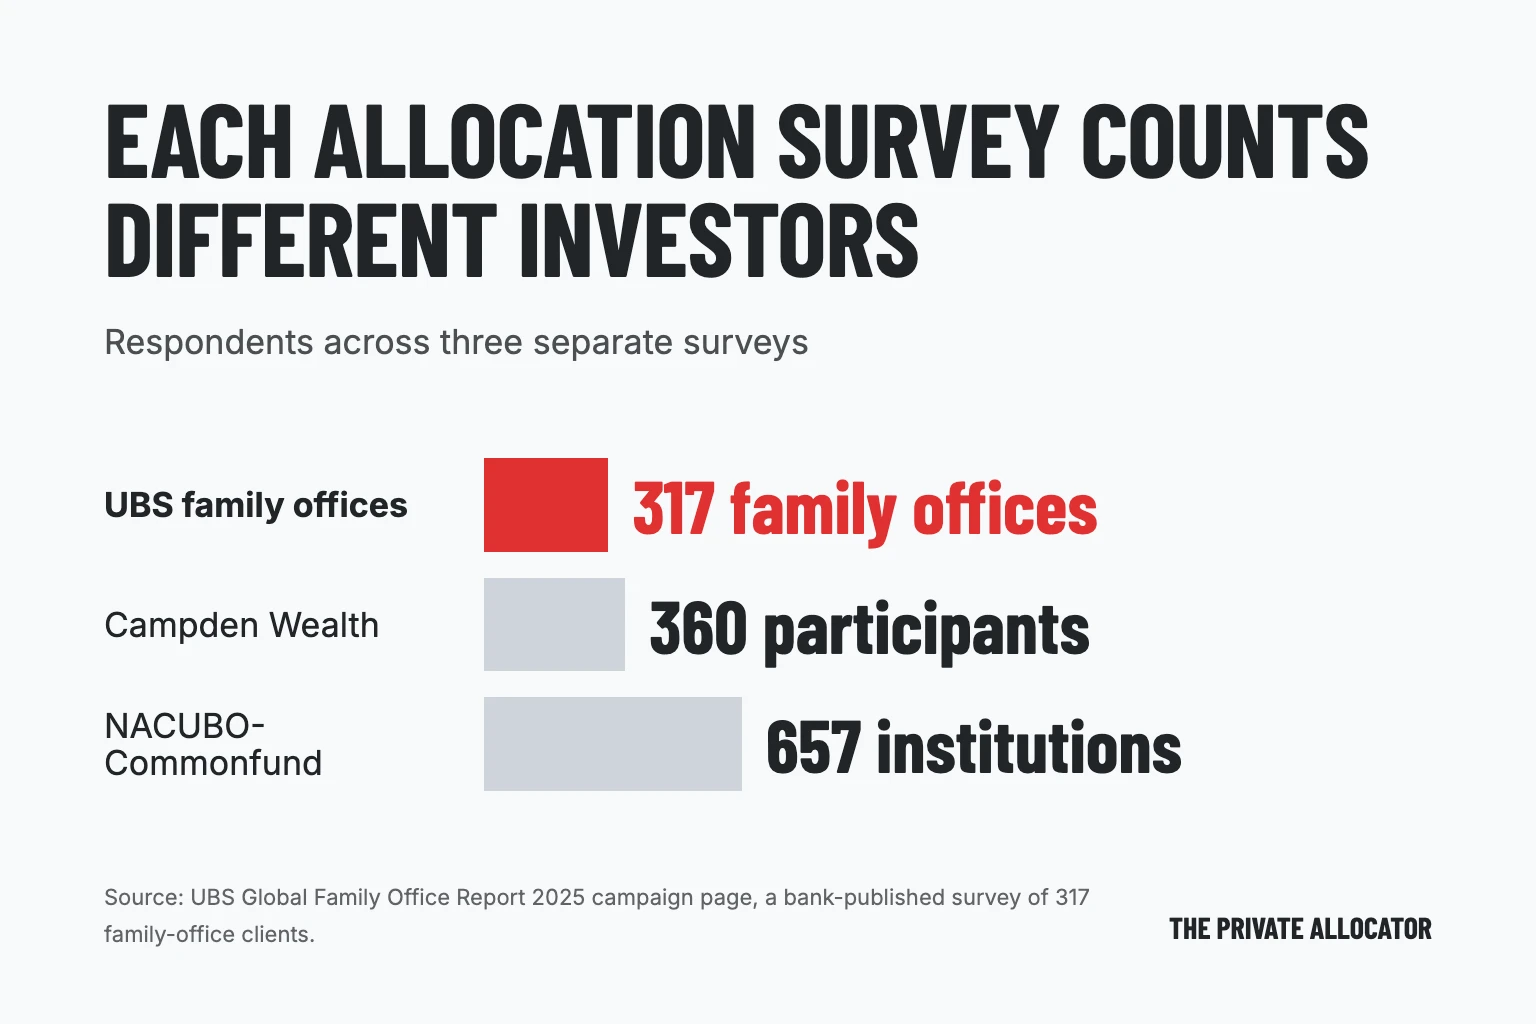
Other surveys describe other groups. Campden Wealth's 2024 family-office reports drew 360 participants, 101 in Europe and 183 in North America2. The FY25 NACUBO-Commonfund Study of Endowments covered 657 institutions with a median endowment of $253.6 million3. Each is a different population measured on a different scale.
Three allocation surveys, three different populations
Three separate survey panels. UBS surveyed 317 family offices with average family net worth of $2.7 billion and average assets under management of $1.1 billion. Campden Wealth's 2024 reports drew 360 participants, 101 in Europe and 183 in North America, with no wealth measure published on the source page. The FY25 NACUBO-Commonfund study covered 657 institutions with $944.3 billion in assets and a median endowment of $253.6 million. Respondent counts are drawn on one 0 to 700 scale; the wealth measures are listed as text because each survey measures something different.UBS Global Family Office Report 2025
317 family officesFamily offices · bank-published client survey
- Average family net worth
- $2.7B
- Average assets under management
- $1.1B
Campden Wealth 2024 family-office reports
360 participantsFamily offices · 101 in Europe, 183 in North America
- Wealth measure
- Not published on the source page
FY25 NACUBO-Commonfund Study of Endowments
657 institutionsColleges, universities and affiliated foundations
- Median endowment
- $253.6M
- Total endowment assets
- $944.3B
Filled bars: respondents, one shared scale. Wealth measures are listed, not drawn: each survey reports a different quantity.
Source: UBS Global Family Office Report 2025 campaign page, a bank-published survey of 317 family-office clients1. Campden Wealth research page, 2024 family-office reports, 360 participants2. Commonfund release, FY25 NACUBO-Commonfund Study of Endowments, 657 institutions3. Respondent counts share one scale; the wealth measures differ by survey and are not comparable.
Figure data
| Survey | Population | Respondents | Wealth measure |
|---|---|---|---|
| UBS Global Family Office Report 2025 | Family offices · bank-published client survey | 317 family offices | Average family net worth: $2.7B; Average assets under management: $1.1B |
| Campden Wealth 2024 family-office reports | Family offices · 101 in Europe, 183 in North America | 360 participants | Wealth measure: Not published on the source page |
| FY25 NACUBO-Commonfund Study of Endowments | Colleges, universities and affiliated foundations | 657 institutions | Median endowment: $253.6M; Total endowment assets: $944.3B |
That changes what you can reasonably ask of a survey. A client survey tells you something about its respondents. Whether it applies to anyone else depends on how the sample was built, who answered and what the question actually was.
Start with the population named in the methodology. Does "family office" mean an organization serving one family, an adviser serving several unrelated families, or something else? Does the respondent answer for the whole family or only for the assets inside one investment mandate? Reports with similar titles don't always use the same definition.
Then separate selection from nonresponse. Selection is who could be surveyed at all. Nonresponse is who was invited and didn't answer. Families outside a bank's client list may look different from those on it, and clients who replied may look different from those who didn't.
Neither problem proves a finding wrong. It means you can't tell which way a bias runs or how large it is, and a big sample doesn't fix that. The UBS summary gives no response rate and doesn't say whether nonrespondents held similar portfolios. Treat both as unknown, and don't fill the gap with a story about what wealthy families "must" be doing.
The useful starting point is your own private market portfolio map, which ties assets to what they have to pay for. A survey can add questions to that map. It can't supply the answers only you have.
What wealth measure does the survey cover?
Family net worth, assets managed by an office and cash available to invest are three different numbers. Before you compare yourself with a surveyed family, check which one sits behind the headline and which one sits under the allocation table.
Net worth is assets minus liabilities within whatever scope the report sets. Managed assets are what falls under a management relationship or mandate. Neither tells you how much can be spent without selling something, borrowing or waiting for a payment.
Check whether business ownership, a home or assets held elsewhere are included. The public summary may not say. If it doesn't, write that down rather than treat managed assets as the whole family balance sheet.
An average doesn't describe every respondent, either. A few very wealthy families can pull a mean far from everyone else, and without the distribution you can't see how tightly respondents cluster around it. It certainly doesn't set a wealth level at which an allocation becomes right for you.
Allocation tables need one more check: what is the denominator? A share of managed investment assets is not a share of everything a family owns. A table can be accurate and still answer a different question from yours.
Suppose your operating business sits outside your investment accounts. Copy an investment-account allocation without counting the business, and you could end up with far more business risk than your statements suggest.
Before adding a new asset class, look at private investment concentration across what you already own. Do your income, your business equity and your investments depend on the same economic conditions? A survey's category labels can't answer that for you.
How do endowment allocation surveys differ?
Commonfund's release for the NACUBO-Commonfund Study of Endowments covers colleges, universities and affiliated foundations, and ties endowment spending to running those institutions3. That is an institution with a mission, not an individual paying for a life and a family.
So before comparing allocations, ask what the portfolio must fund, who decides on spending and what obligations constrain those decisions. An institution's mission tells you nothing about how much uncertainty you can live with around your next large expense.
Don't read "endowment" as "no cash needs". The surveyed institutions collectively spent from their endowments in FY253. The useful comparison is how that spending is funded and governed, and whether you have anything like it.
Then ask who does the work. An endowment may use investment staff, committees or outside specialists. You may have to do the same work yourself or pay someone to. Check the report before assuming a staffing model, and check your calendar before assuming you can copy it.
The question worth borrowing is how investment decisions connect to spending and oversight. Write that connection into your family investment policy using your own responsibilities, rather than adopting an institutional allocation because it sounds authoritative.
Check what an allocation survey actually measures
Even once you know the population, slow down before reading a chart. A current holding, a policy target and an intention to invest are different things. Read the question and the caption to see which one you're looking at.
An intention doesn't mean the investment happened. A holding doesn't explain why it's held. A target doesn't mean the investor can reach it soon. When an article turns those into "families are moving into" an asset class, go back to the survey's wording.
Check whether an average counts each respondent equally or weights them by assets. Those give different answers. If the report doesn't say, don't treat the result as what a typical family chose.
Comparing reports needs the same care. Category boundaries and valuation dates differ, and a change in a reported share can come from price moves as much as from buying or selling. The chart alone may not tell you which.
| Ask this question | Record this distinction |
|---|---|
| Who could participate? | Separate the eligible population from the group that responded. |
| What assets are counted? | Separate the reported portfolio from your full balance sheet. |
| What did the question ask? | Distinguish holdings, targets and stated intentions. |
| How was the average calculated? | Check whether respondents or assets determine the weighting. |
| What information is missing? | Mark missing methodology or allocation details as unknown. |
| Why would this apply to me? | Name the constraint of yours that makes the comparison relevant. |
If an allocation table or its definitions aren't published, leave the allocation out. Don't rebuild it from a headline, a neighboring statistic or a different survey.
Which questions transfer to you?
Set a cash-flow goal and decide how long a lockup you can tolerate before you look at any deal. That is a better place to start than someone else's allocation.
Start with the spending your portfolio must support. Which bills get paid even if your income falls or an expected distribution arrives late? Which goals could move, and who bears the cost of moving them? Describe the obligation before you choose an asset to meet it.
Next, separate wealth from cash you can use. An asset can be valuable and still unavailable. Write down what you could spend without relying on an uncertain sale or payout. A survey's reported allocation doesn't tell you where your own cash would come from.
Then count attention. Who reads the notices, reconciles the records, chases missing information and keeps the whole picture current? Private holdings can require ongoing administration123. Your time is a constraint, and a prestigious comparison doesn't remove it.
Settle disagreements before they turn into investments. Family members may differ on spending flexibility, uncertainty and how much oversight they want to take on. An investment policy statement records the shared purpose and what should trigger a review.
Write down what your portfolio must fund, what cash you can reach, what risks you already carry and who keeps the records before you hold any survey up against it.
Source notes
Respondent count, average net worth and sample description come from the UBS Global Family Office Report campaign page, published by the bank that ran the survey1. Campden Wealth's participant counts come from its research page, which publishes no wealth measure for the 2024 sample2. Endowment figures come from Commonfund's release on the NACUBO-Commonfund Study of Endowments3. The reading questions are our own.